Sample trace report · The switching figure
1Exhibit · Report view
Heard
“Forty-seven percent of households want to switch supplier.”
- Appearances
- 7
- Measured
- 1
- Changed
- 5 of 6
| When | Where it appeared | Type | Wording | Figure | What changed |
|---|---|---|---|---|---|
| Mar 2023 | Harwick Household Energy Survey | Survey | “31% would consider switching if the standing charge fell by a fifth” | Figure31% | What changedFirst measurement |
| Apr 2023 | Northfold Institute brief | Brief | “31 percent of households would consider switching at a fifth off the standing charge” | Figure31% | What changedUnchanged |
| Jun 2023 | Calder Evening Post | News | “nearly a third of households would switch supplier” | Figure33% | What changedRounded up, condition lost |
| Nov 2023 | Harwick Council minute | Minute | “a third of households will switch” | Figure33% | What changed“Would” became “will” |
| Feb 2024 | Committee evidence session | Hearing | “36 percent of households want to switch” | Figure36% | What changedNew figure, “will” became “want to” |
| May 2024 | Brenmoor Weekly column | Column | “four in ten households want to switch” | Figure40% | What changedRounded up |
| Sep 2024 | Committee statement | Speech | “forty-seven percent of households want to switch supplier” | Figure47% | What changedNew figure, no source given |
SourceHarwick Household Energy Survey 2023, table 4.2, row 7
Checked
Tracedby Rowsource
Newsrooms, institutes and council research units that trace with Rowsource · sample names
The evidence
Most figures have changed by their third retelling.
We traced 4,212 figures quoted in a sample of energy, housing and health coverage. By the third retelling, 68 percent no longer matched their source (Exhibit 2). Few of the changes were lies. Most were small edits that seemed harmless at the time. Rowsource marks each one, so you can see where a figure moved before you quote it.
How the 2,864 changed figures changed
- Rounded toward a tidier number38%
- Lost a condition or a qualifier27%
- Moved to a different base, such as all adults for households16%
- Moved to another year or period9%
- Other changes10%
2Exhibit · Chart, sample corpus
Drift by retelling
Traced figures that no longer match their source, cumulative.
- Share changed by that retelling
- Third retelling
SourceSample corpus 2023 to 2025, table D3
Checked
Tracedby Rowsource
- Figures traced
- 4,212
- A sample of energy, housing and health coverage, 2023 to 2025
- Changed
- 68%
- By the third retelling, from Exhibit 2
- Retellings
- 1.8
- The mean before a figure first changed
- Lost a condition
- 27%
- Share of the 2,864 changed figures
How a trace works
Paste one sentence and get back the whole chain behind it.

Start with the sentence as you heard it. Rowsource searches your archive, public records and the 212 sources it indexes, then lays out 7 appearances of the figure, oldest first (Exhibit 3).
- Documents in scope
- 18,406
- Found in your archive
- 3
- Found in public records
- 2
- Found in news and policy
- 2
We follow the chain back until it reaches a document that measured something: here, row 7 of table 4.2 in a household survey, which found 31 percent of 2,140 households.
- Document
- Household survey, PDF
- Where in it
- Table 4.2, row 7, p. 38
- Base
- 2,140 households
- How it was counted
- Reported in a survey
Each step where the figure moved is labelled with what changed, so you can quote the source or report the drift. In this chain the figure moved at 5 of 6 retellings.
- Rounded
- 2 steps
- New figure
- 2 steps
- Verb or tense
- 2 steps
- Condition lost
- 1 step
When the trace finishes
The chain, the table it came from and every change go into one report, the one in Exhibit 1, which your desk can cite or export.
3Exhibit · Workspace, in three states
One sentence, traced
Followed through three archives to the table that counted it.
- Documents searched
- 17,904
- Appearances
- 7
- Measured
- Pending
- Changed
- Pending
Your archiveDone
3 found · 6,212 of 6,212
Public recordsDone
2 found · 4,870 of 4,870
News and policy indexSearching
2 found · 6,822 of 7,324
- Mar 2023Harwick Household Energy Survey“31% would consider switching if the standing charge fell by a fifth”Records · 1.4 s
- Apr 2023Northfold Institute brief“31 percent of households would consider switching at a fifth off the standing charge”Index · 1.7 s
- Jun 2023Calder Evening Post“nearly a third of households would switch supplier”Archive · 0.5 s
- Nov 2023Harwick Council minute“a third of households will switch”Records · 1.1 s
- Feb 2024Committee evidence session“36 percent of households want to switch”Archive · 0.8 s
- May 2024Brenmoor Weekly column“four in ten households want to switch”Just inIndex · 2.0 s
- Sep 2024Committee statement“forty-seven percent of households want to switch supplier”Archive · 0.3 s
Four of the seven appearances cite nothing. The committee statement is one of them.
SourceNot reached yet
CheckedNot yet
Searchingby Rowsource
4Exhibit 4 · The counted world
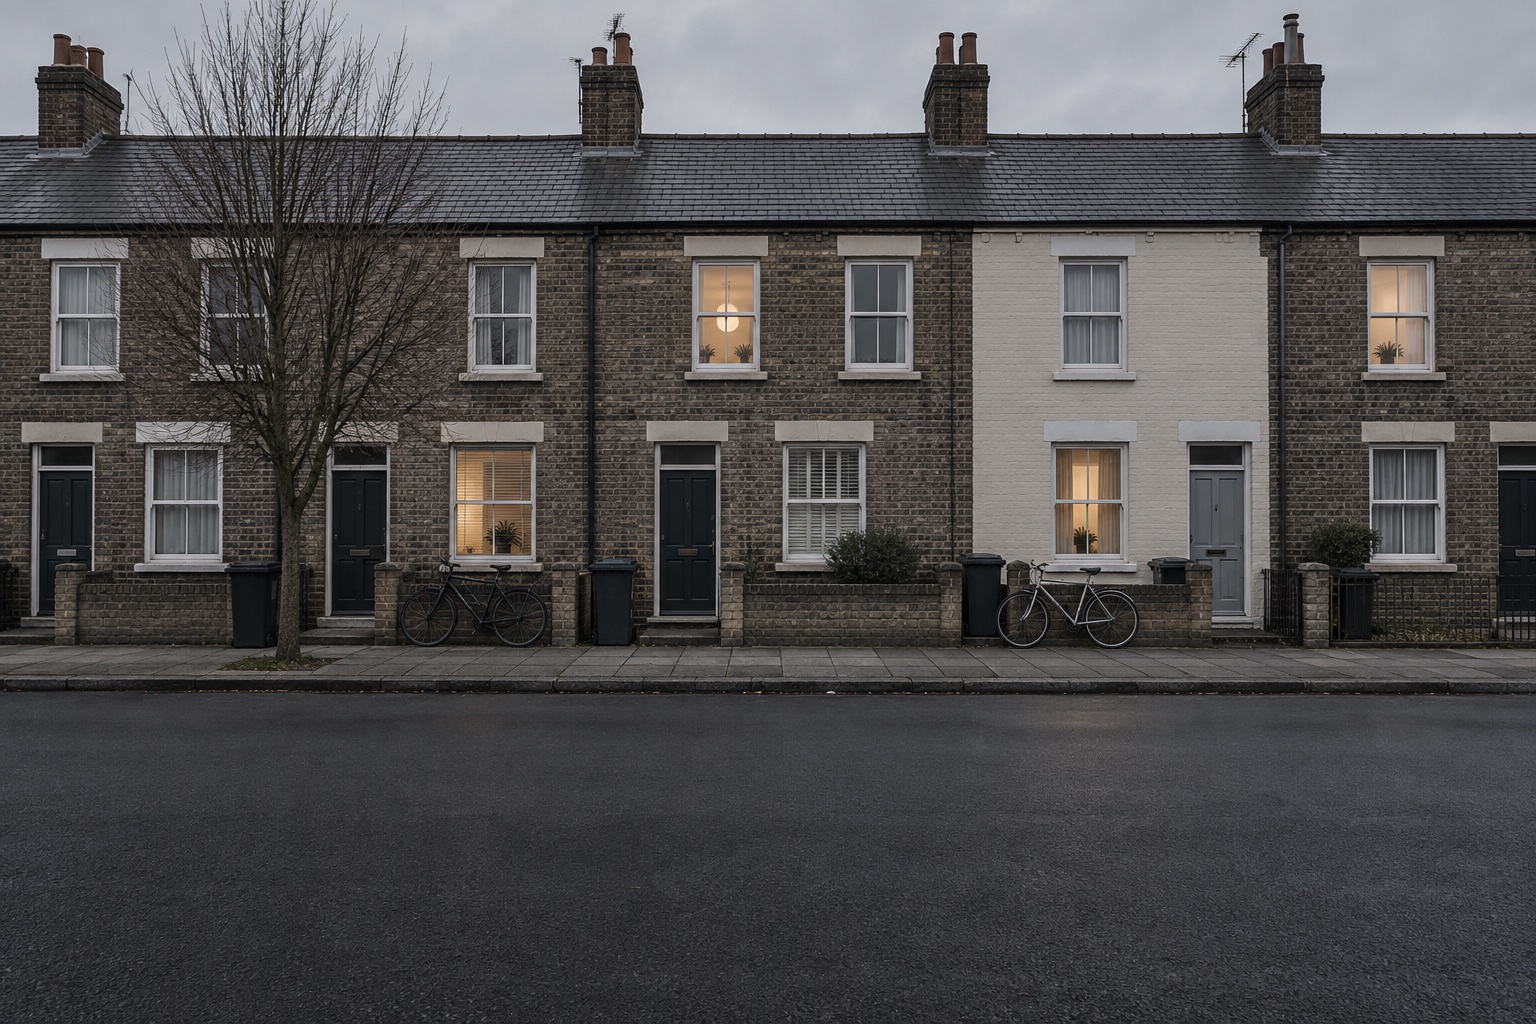
Behind table 4.2 are 2,140 front doors.
How it was counted
Rowsource knows a meter reading from an opinion.
Three ways a figure gets counted
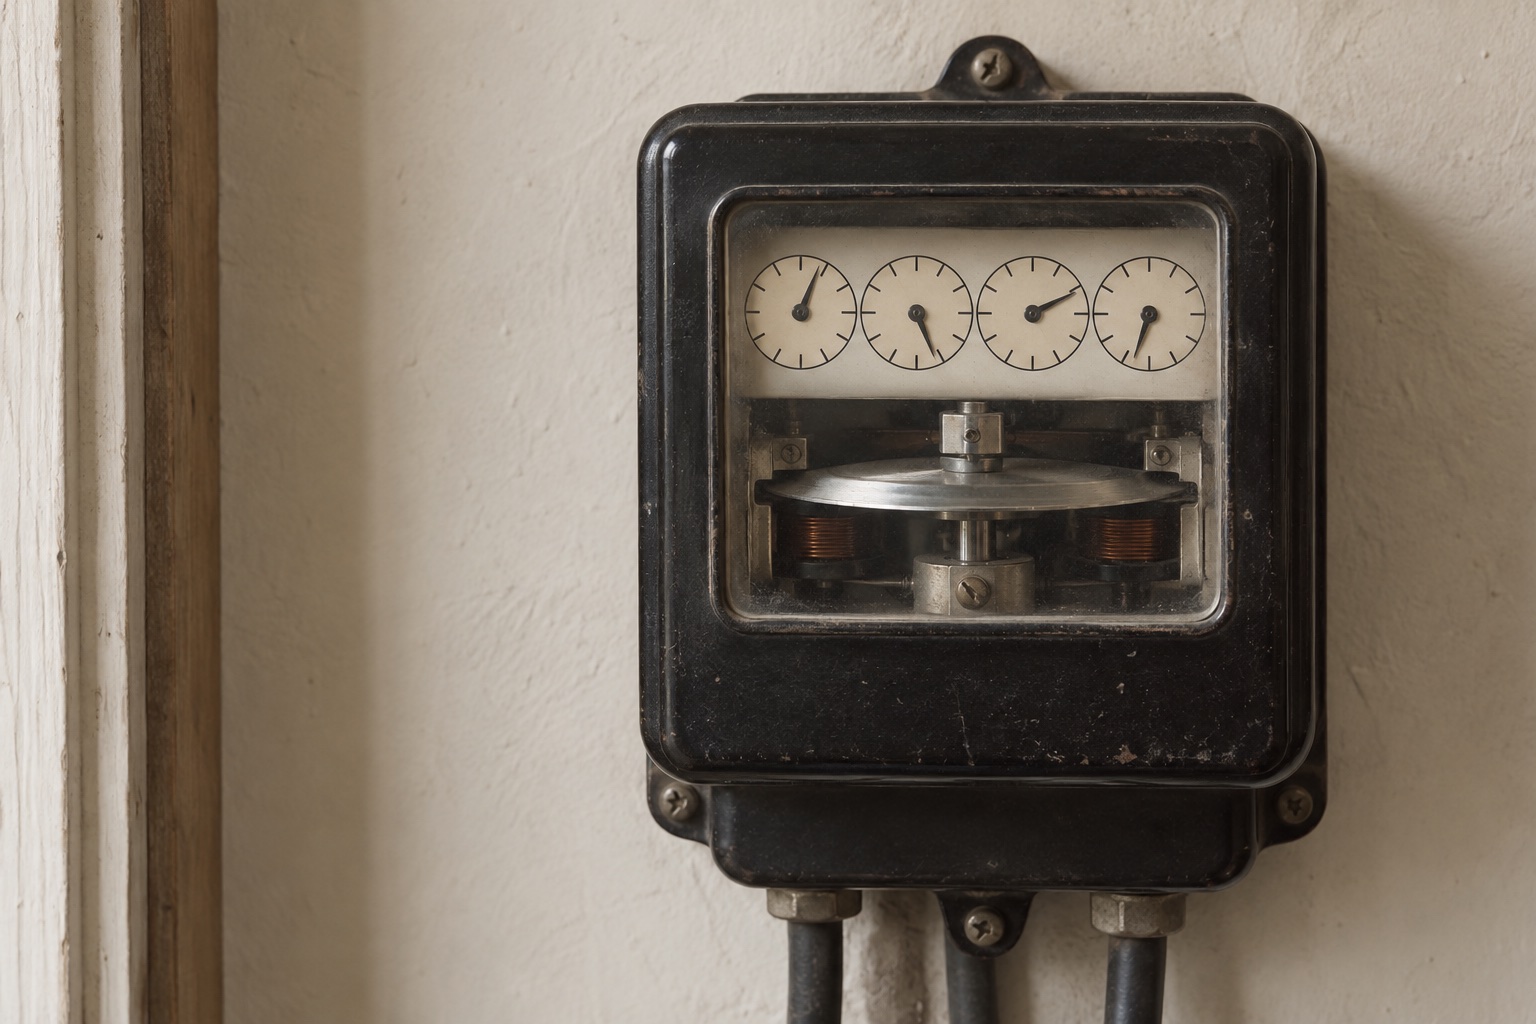
- MeasuredRead off an instrument, such as a meter.
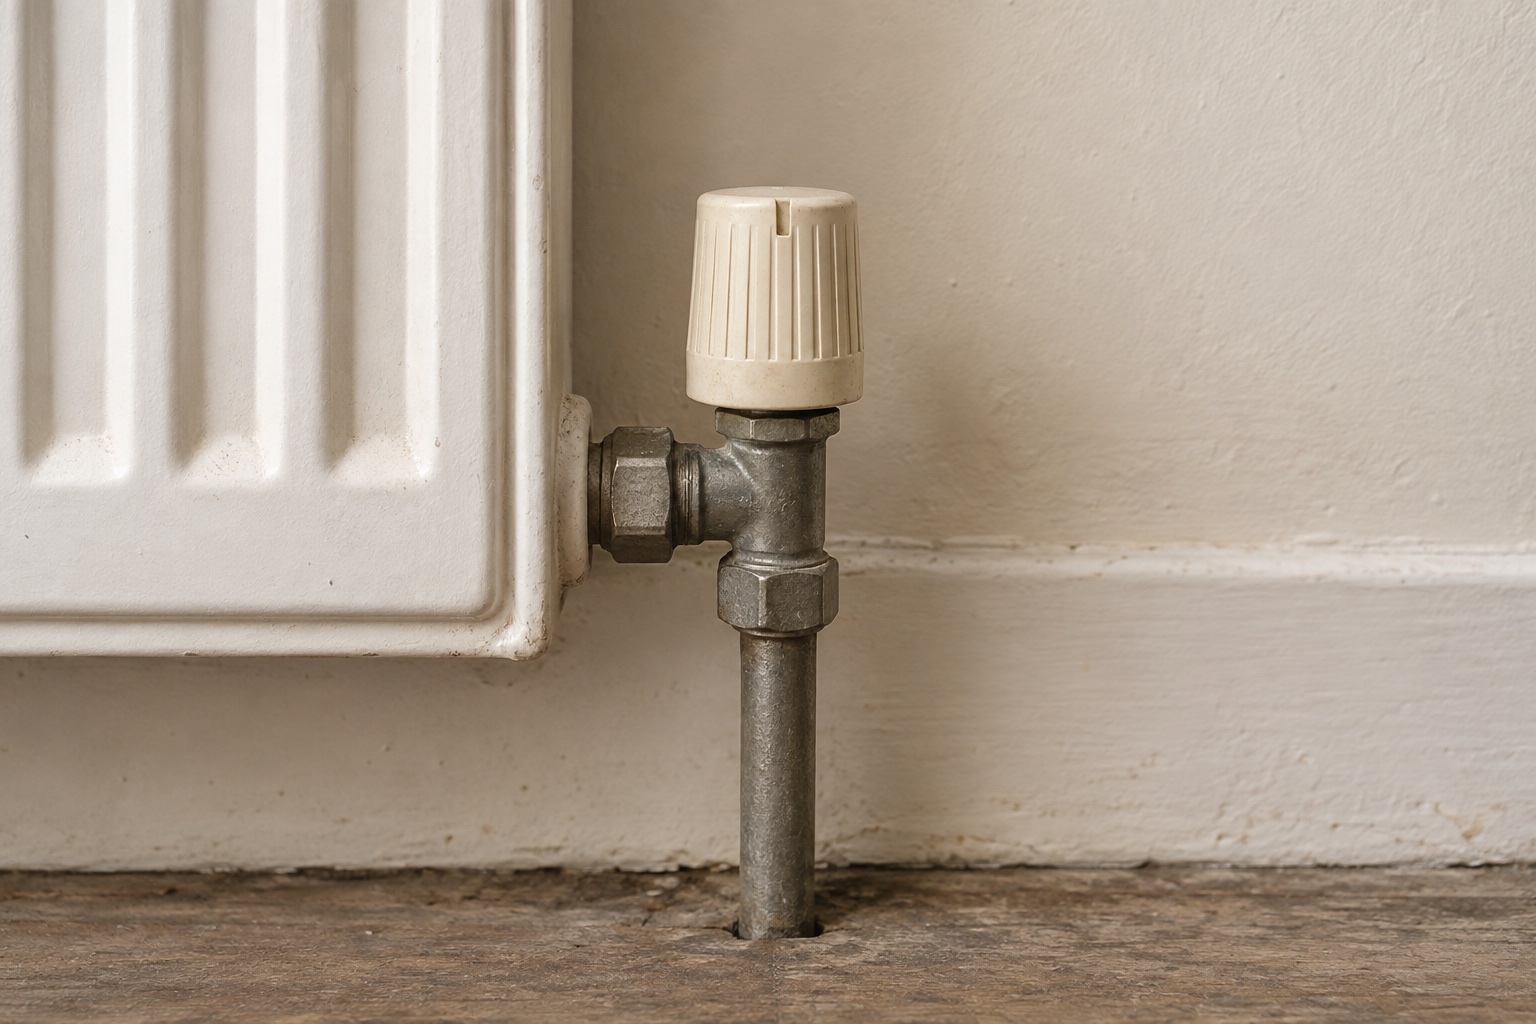
- Set by the householdChosen by someone, such as a valve setting.
- Reported in a surveyWhat people said when they were asked.
Some household figures are read off an instrument. Others are what people said they would do. We record how each source was counted, so your desk can tell a reading (Exhibit 5) from a setting someone chose (Exhibit 6), and both from an answer to a survey question. Exhibit 4 is one of the streets behind table 4.2.
5Exhibit · A reading
6Exhibit · A setting
Results
Corrections fell at every desk in the first year.
Across five desks, corrections for misquoted figures fell from 4.2 to 1.6 per thousand published pieces in their first year on Rowsource (Exhibit 7). The largest fall was at the broadcast newsroom, where most figures reach air through a script nobody traced.
Exhibit 7 · Chart, five desks
Corrections, before and after
Corrections for misquoted figures per 1,000 published pieces.
- The year before
- First year on Rowsource
- All five desks
SourceFive desks’ corrections logs, table C2
Checked
Tracedby Rowsource
Readers
“It took four minutes to find the table everyone had been misquoting.”
On tracing the 47 percent figure with Rowsource, the week the Post corrected its June story. Sample quote.

Plans
A desk licence covers every trace your team runs.
A Rowsource desk licence is £480 a month for up to six people, with no limit on traces. Your archive stays yours: export it whole at any time, or take it with you if you leave (Exhibit 8).
Desk
£480
a month, billed monthly
For one research desk of up to six people.
- Unlimited traces
- Your archive and public records
- The news and policy index
- Exports and citations
Newsroom
£1,650
a month, billed yearly
For newsrooms that run several desks, up to 25 people.
- Everything in Desk
- A shared corrections log
- Single sign-on
- A named research lead
Institute
£2,400
a month and up, billed yearly
For institutes and councils that publish their own figures.
- Everything in Newsroom
- Your releases indexed on publication
- An audit trail for each published figure
- Hosting in the UK
Sample prices in pounds, before VAT.
Exhibit 8 · Desk settings
The desk licence
The Calder Evening Post’s licence, as its research desk sees it.
Calder Evening Post
Research desk
- Plan
- Desk licence
- Price
- £480 a month
- Seats
- 4 of 6 used
- TracesNo limit · 212 run this month
- SourcesYour archive, public records and 212 indexed sources
- ReportsLink, print or export any trace as a table
- ArchiveKept while you subscribe, handed over in full if you leave
SourcePrice list 2026, table 1, row 1
Checked
Tracedby Rowsource
Request a trace
Send us the figure you trust least.
Rowsource sends back the report and its full chain within one working day.
Private by defaultWe never publish a figure you send us.
Read by a researcherSomeone on our desk checks it before it goes out.
Three traces freeNo card and no contract to sign.